Sidebar
wasp_lum
Table of Contents
Waspmote Luminosity Sensor (LDR)
Quick Data
- Model: API PDV-P9203
- Resistance in darkness: 20MΩ
- Resistance in light (10 lux): 5 ~ 20kΩ
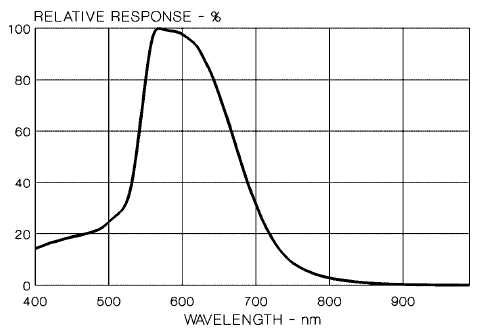
- Spectral range: 400 ~ 700nm (approximately equal to human eye)
- Some approximate LUX levels obtained with this sensor.
- Dim Hallway: 0.1 lux
- Full moon, clear night: 1 lux
- Dark room: 10 lux
- Bright room/overcast day: 100 lux
Conversion Method
Converting to Illuminance (lux)
The output of the waspmote to the database is a voltage reading of the sensor. All the waspmote types have a LDR sensor but note that the conversion method differs between Type A and Type B,C since the supply voltage differs.
Step 1. Determine board type and voltage supply to sensor:
- Type A (Cities Board): 3.3v supply
- Type B and C (Gas Board): 5.0v supply
Step 2. Convert to kiloohms R = 10k * ( (Vcc- Vout) / Vout )
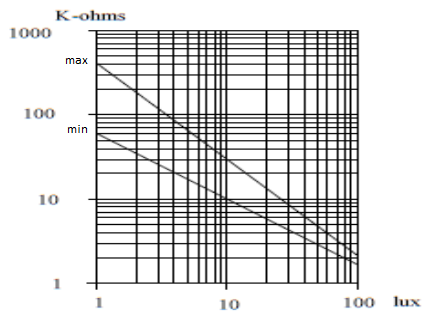
Step 3. Compare to sensor response graph to match resistance reading to lux, taking into account the spectral response of the sensor. See notes.
Sensor Response Characteristics
Example
Measurement of 1.97v is observed from the databases on a Type B board.
- Vcc = 5.0v for B type.
- RkΩ = 10 * ((5.0 - 1.97) / 1.97)
- RkΩ = 15.38
- So lux measured by the sensor would approximate between 7-20 lux.
- This reading is a percentage of the true lux, as can be seen in the spectral response graph. However obtaining accurate wavelength data of the surrounding light requires extra specialised equipment.
Notes
- Lux measurement is subject the the spectral response of the sensor, i.e. a bright blue lit room will read a significantly lower lux than a similarly bright green/yellow lit room of the same true lux.
- A low cost LDR like the one used is not intended for measuring exact lux, but rather to observe trends and indicate the presence of light. Exact lux can only be determined alongside spectral analysis (unavailable on the waspmotes).
- There are two logarithmic lines on the sensor response graph, one indicating minimum lux, the other maximum and the true value will fall between the two.
- Most sensors are positioned on the ceiling, away from the artificial light source, with the sensors having a greater response to daylight.
Downloads
Links
wasp_lum.txt · Last modified: 2021/01/10 23:16 (external edit)


