User Tools
Sidebar
Table of Contents
Waspmote Air Contaminants Sensor
Quick Data
- Model: Figaro TGS 2602
- Gases: Primarily: Toluene, Hydrogen Sulphide, Ethanol, Ammonia. Also sensitive to Hydrogen
- Measurement range: 1 ~ 30ppm
- Air resistance: 10 ~ 100kΩ
- Sensitivity: 0.15 ~ 0.5 (ratio between the resistance in 10ppm of Ethanol and in air)
- Load resistor: 10kΩ, Gain: 1, Supply voltage: 5V DC
- Some approximate gas ppm levels for reference
- Toluene
- Typical City: 0.075 ppm
- Adverse Effects: 500 ppm
- Life Threatening: >2000 ppm
- Hydrogen Sulfide
- Odour threshold: 0.00047 ppm
- Adverse Effects: 50 ppm
- Life Threatening: >500 ppm
- Ethanol
- Typical Indoor: <0.5 ppm
- Exposure while refuelling car: 50ppm
- Adverse Effects: 1000 ppm
- Ammonia
- Typical Atmosphere: 0.006 ppm
- Adverse Effects: 24 ppm
- Life Threatening: 2500 ppm
- Hydrogen
- Typical Atmosphere: 1 ppm
- Adverse Effects: 10 ppm
- Life Threatening: >150 ppm
Conversion Method
Converting to Concentration of Pollutant Gases in Air (parts per million)
The output of the waspmote to the database is a voltage reading, as can be seen from the circuit diagram below, this reading is affected by the input voltage, sensor resistance and load resistance.
To convert to ppm, the voltage reading is applied as follows
Step 1. Convert voltage reading to sensor resistance: Rsensor = ( ( Vcc * Rload ) / Vout ) - Rload
Step 2. Determine sensor resistance in air Ro. For an assumed “clean-air” value simply use the minima value that sensor has output over its lifetime at 20�C and 65% R.H.
Step 3. Normalise against resistance under air: Rsensor / Ro(Typical Resistance in Air)
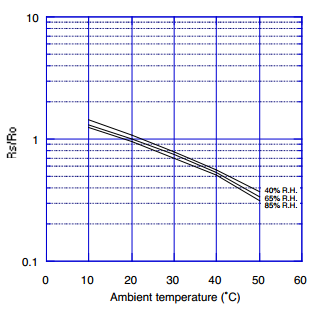
Step 4. Adjust Rs/Ro for temperature/humidity sensitivity. Multiply by the result given in the dependency graph for the conditions at time of voltage reading.
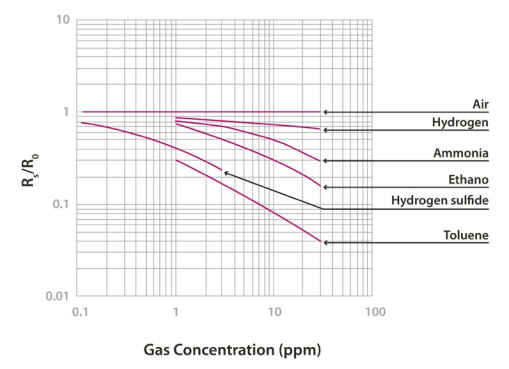
Step 4. Compare adjusted normalised result against sensor response diagram:
Sensor Response Characteristics
Example
Measurement of 1.8529v is observed (from our databases) with corresponding conditions of 17°C and 85% R.H. A minima for that sensor was observed a few months prior at 1.6 volts in ideal test conditions (20°C and 65% R.H)
- Rs = ((10000 * 5) / 1.8529) - 10000
- Rs = 16985
- Typical resistance in Air varies greatly sensor to sensor, we use our minima reading of 1.6v from that particular sensor as baseline “clean-air” resistance.
- Ro = ((10000 * 5) / 1.6) - 10000
- Ro = 21250
- Normalised Resistance Rs/Ro = 16985/21250 = 0.799
- As we can see on the temp/humidity dependency graph, 17°C and 85% R.H gives us a Rs/Ro modifier of 1.1x. New Rs/Ro = 1.1 * 0.799 = 0.8792
- Modified Normalised resistance = 0.8792. On the response graph we can see that value intersects a Hydrogen component around 1ppm which matches a baseline reading with no notable traces of other pollutants (since their logarithmic lines do not pass through that Y-component) .
Notes
- A standard Rs/Ro reading should fall between ~0.8 and 1 to indicate clean air. A lower reading indicates concentrations of potentially dangerous gases that need further measurement.
- If your Rs/Ro value intersects multiple gases on the response graph, it is impossible to determine which gas or gases the sensor is responding too without extra equipment.
- Baseline typical air resistance should be taken in ideal conditions of 20°C and 65% R.H to avoid skew from the sensor dependancy on temperature and humidity.
- Typical resistance in air varies widely between sensors making calibration of the sensor necessary for final application.


